



Tennis at 1xBet
Tennis betting at 1xBet rewards people who read the market screen properly — not those who “watch form” in the abstract, but those who understand what a -3.5 games handicap actually requires, why a combined market like “W1 and Total Under 22.5” prices differently than the sum of its parts, and how much margin is actually built into each type of bet. This guide works through real 1xBet match screens — full match odds, live in-play pages, and set-level markets — with the actual numbers as they appeared, including the calculations a bettor should be doing but usually isn’t.
Why There’s No “X” in Tennis Betting
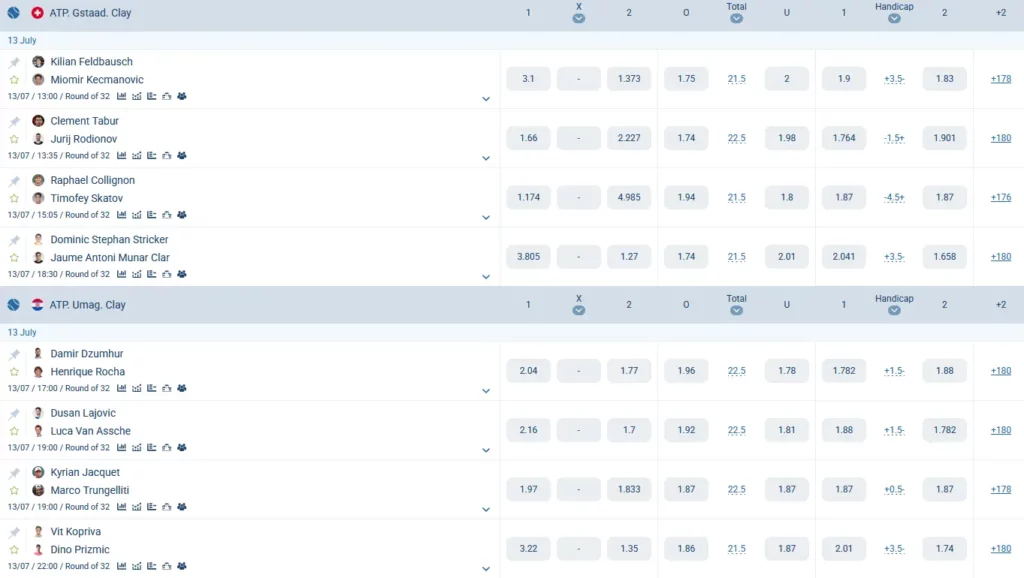
Every match line shows three columns — 1, X, 2 — but the X (draw) column is always a blank dash. Tennis can’t end in a draw: a set can’t be tied, and neither can a match. The 1X2 label is inherited from football’s market template; for tennis it functions as a pure two-way market, W1 versus W2.
Tennis Bets at 1xBet
How to Calculate the Bookmaker’s Margin Yourself
Every price 1xBet quotes has a built-in margin (sometimes called the “vig” or “overround”). It’s simple to calculate and worth doing on every bet slip before placing money:
Implied probability = 1 ÷ decimal odds, expressed as a percentage. Add up the implied probabilities of every outcome in a market, and anything above 100% is the operator’s margin.
Take the ATP Gstaad match between Kilian Feldbausch (odds 3.1) and Miomir Kecmanovic (odds 1.373):
- Feldbausch: 1 ÷ 3.1 = 32.3%
- Kecmanovic: 1 ÷ 1.373 = 72.8%
- Total: 105.1% — meaning the built-in margin here is 5.1%
Run the same calculation across every straight match-winner (1X2) line from the screenshots, and a clear pattern emerges:
| Match | Odds | Implied probabilities |
|---|---|---|
| Tabur (1.66) vs. Rodionov (2.227) | 60.2% + 44.9% | 105.1% |
| Collignon (1.174) vs. Skatov (4.985) | 85.2% + 20.1% | 105.3% |
| Stricker (3.805) vs. Munar Clar (1.27) | 26.3% + 78.7% | 105.0% |
| Dzumhur (2.04) vs. Rocha (1.77) | 49.0% + 56.5% | 105.5% |
| Lajovic (2.16) vs. Van Assche (1.7) | 46.3% + 58.8% | 105.1% |
| De Jong (1.44) vs. Gaubas (2.794), live | 69.4% + 35.8% | 105.2% |
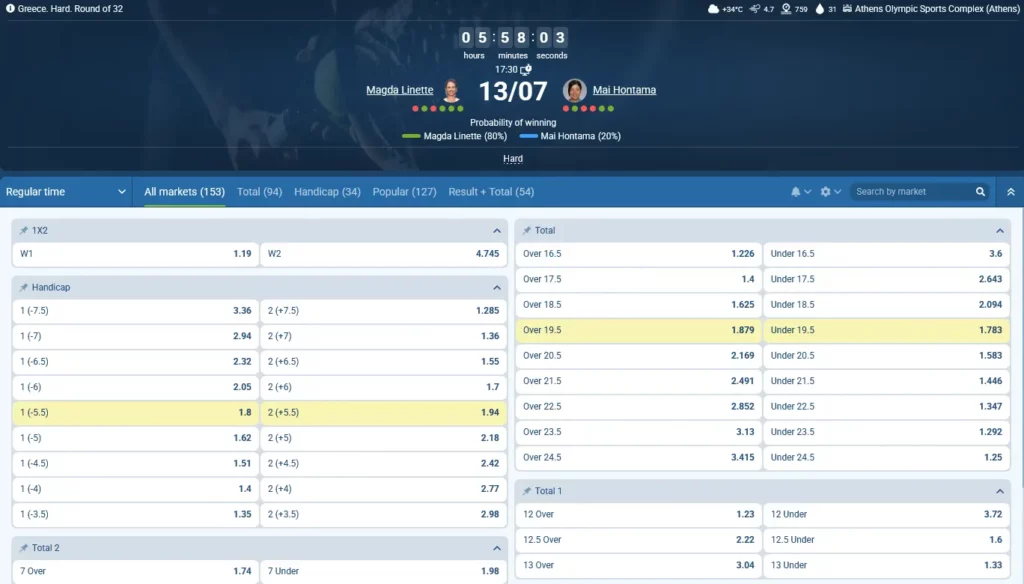
| Linette (1.19) vs. Hontama (4.745), live | 84.0% + 21.1% | 105.1% |
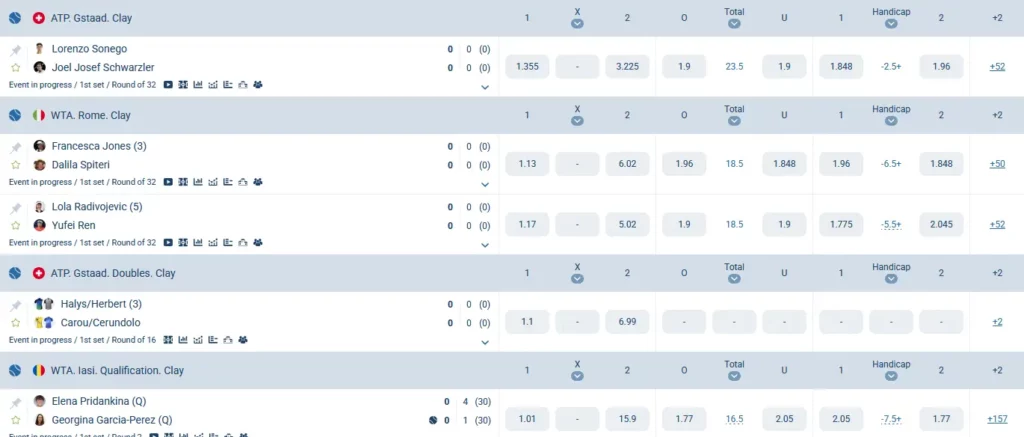
| Halys/Herbert (1.1) vs. Carou/Cerundolo (6.99), doubles | 90.9% + 14.3% | 105.2% |
| Pridankina (1.01) vs. Garcia-Perez (15.9), qualifying | 99.0% + 6.3% | 105.3% |
The margin holds in an unusually tight band — roughly 5.0% to 5.5% — whether it’s a marquee ATP clash, a live hard-court match, a doubles pairing, or a heavily lopsided qualifying round where one player is priced at 99% to win. That consistency is itself useful information: the straight match-winner market is priced almost identically regardless of how skewed the actual matchup looks, which means the “value” in a heavy-favorite match isn’t hiding in the win/loss line — it’s more likely to show up in a derivative market like handicap or totals, covered next.
Reading the 1X2 Market With Real Odds
Beyond the margin math, the raw numbers tell a story about the matchup itself. Raphael Collignon at 1.174 against Timofey Skatov at 4.985 implies an 85% chance for Collignon — a gap that size on clay usually reflects either a significant ranking difference or a stark surface-form mismatch, and it’s worth checking which, since the two produce very different in-play betting behavior if the favorite drops the first set unexpectedly. Compare that to Clement Tabur (1.66) vs. Jurij Rodionov (2.227), where the implied gap (60% vs. 45%) is far tighter — a genuine coin-flip-adjacent match where in-play markets are likely to swing hard on early break points.
Tennis Live at 1xBet
Games Handicap Explained
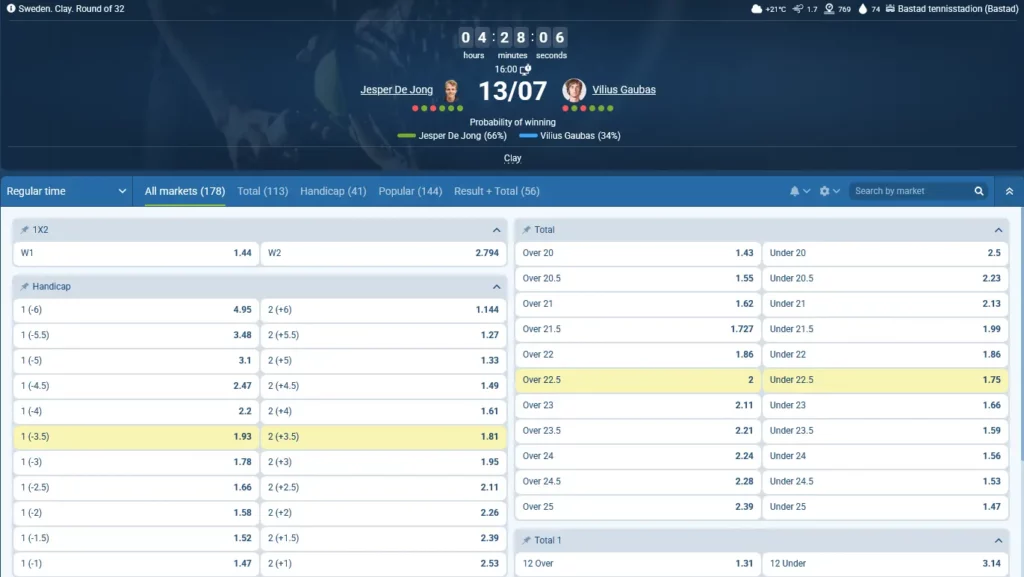
The handicap market isn’t about who wins — it’s about the margin in total games. From the live Sweden clay match, Jesper De Jong vs. Vilius Gaubas:
| Odds | Implied probability | |
|---|---|---|
| 1 (-3.5) | 1.93 | 51.8% |
| 2 (+3.5) | 1.81 | 55.2% |
Total: 107.0% — a 7.0% margin, meaningfully thicker than the 5.1-5.5% seen on the plain match-winner line above. Betting 1 (-3.5) means De Jong needs to win the match by more than 3.5 games combined across all sets — winning 6-2, 6-3 (a 7-game margin) clears it easily, while 6-4, 7-6 (a 5-game margin) still clears it, but a tight 7-6, 6-4 might not depending on the exact tiebreak score. Betting 2 (+3.5) means Gaubas either wins outright or loses by 3 games or fewer.
Checking the handicap margin on the full ATP Gstaad and Umag card confirms this isn’t a one-off:
| Match | Handicap odds | Implied total |
|---|---|---|
| Feldbausch vs. Kecmanovic | 1.9 / 1.83 | 107.2% |
| Tabur vs. Rodionov | 1.764 / 1.901 | 109.3% |
| Dzumhur vs. Rocha | 1.782 / 1.88 | 109.3% |
| Kopriva vs. Prizmic | 2.01 / 1.74 | 107.3% |
Handicap margins here consistently run 7-9%, roughly 2-4 percentage points thicker than the equivalent match-winner line. Half-game lines (-2.5, -3.5, -4.5) are used specifically to prevent a push — a whole-number handicap could land exactly on the actual margin and void the bet, so tennis handicaps sit on the .5 to force a winner every time.
Total Games and Total 1 (First Set) Betting
Total covers every game played across the entire match. In the same De Jong vs. Gaubas match:
| Market | Line | Odds | Implied probability |
|---|---|---|---|
| Total | Over 22.5 | 2.00 | 50.0% |
| Total | Under 22.5 | 1.75 | 57.1% |
Total: 107.1% margin — again in the same 7% band as the handicap market.
Total 1 is a separate, narrower market covering only the first set. From the same match: 12 Over at 1.31 (76.3% implied) versus 12 Under at 3.14 (31.8% implied), summing to 108.1%. The heavy lean toward “Over” on this specific line suggests the market expected a competitive, potentially tiebreak-bound first set. In the detailed Sonego vs. Schwarzler match page, Total 1 (13.5 games) priced Over at 2.21 (45.2%) against Under at 1.62 (61.7%) — the opposite lean, implying an expected quicker first set. Confusing Total (whole match) with Total 1 (first set only) is one of the most common reading errors in tennis betting, since the two lines can point in completely different directions within the same match — as they do here.
Total 2 appears specifically on live match pages once the first set is known or underway — it covers games in the second set only. On the Linette vs. Hontama match, Total 2 priced 7 Over at 1.74 (57.5%) against 7 Under at 1.98 (50.5%), a 108.0% total.
Live Tennis at 1xBet
Set-Level Markets: Correct Score, Exact Total Sets, and Win in Sets
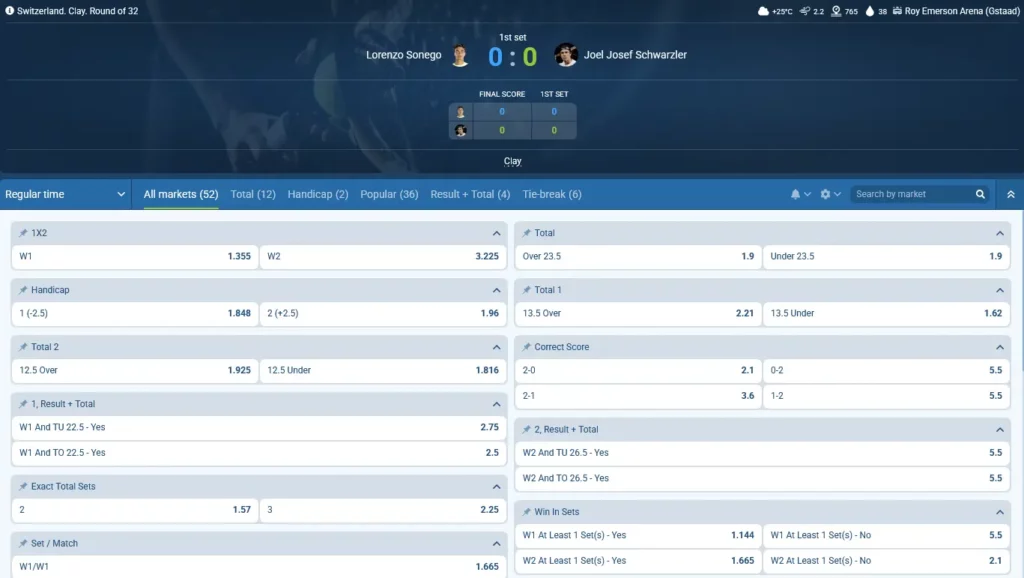
The detailed Sonego vs. Schwarzler match page (Switzerland, clay, first set 0-0) shows the fuller range of set-based markets:
| Market | Selection | Odds | Implied probability |
|---|---|---|---|
| Correct Score | 2-0 | 2.10 | 47.6% |
| Correct Score | 2-1 | 3.60 | 27.8% |
| Correct Score | 0-2 | 5.50 | 18.2% |
| Correct Score | 1-2 | 5.50 | 18.2% |
| Exact Total Sets | 2 | 1.57 | 63.7% |
| Exact Total Sets | 3 | 2.25 | 44.4% |
| Set/Match | W1/W1 | 1.665 | 60.1% |
| Win In Sets | W1 at least 1 set — Yes | 1.144 | 87.4% |
| Win In Sets | W2 at least 1 set — Yes | 1.665 | 60.1% |
Correct Score asks for the exact set score in a best-of-three match. Adding up all four outcomes: 47.6% + 27.8% + 18.2% + 18.2% = 111.8% — noticeably the thickest margin of any market covered here, roughly double the plain match-winner line. This is typical of correct-score-style markets across most sports: more possible outcomes means more room for margin to be layered in without any single price looking obviously inflated.
Exact Total Sets is simpler — 2 sets (straight win) versus 3 sets (deciding set needed), totalling 108.1%.
Set/Match combines first-set winner with overall match winner. Since Sonego’s plain match-winner probability was 73.8% (from odds of 1.355), and Set/Match W1/W1 implies 60.1%, that means the conditional probability of Sonego winning the first set given that he goes on to win the match works out to roughly 60.1% ÷ 73.8% ≈ 81.4%. In other words, in the scenarios where the favorite wins the match, he’s expected to take the first set about 4 times out of 5 — useful context for anyone considering a live bet on the underdog after a lost first set, since the model already prices that outcome as the less common path to an eventual win.
Win In Sets asks whether a specific player takes at least one set, regardless of the overall winner — useful for backing the underdog to avoid a straight-sets loss without betting on them to win the match outright. At 1.144 (87.4%) for Sonego taking at least one set, the market considers a straight-sets loss for Schwarzler quite likely but far from certain.
Result + Total Combo Markets
The same match page shows combined markets that pair the winner with a total-games threshold in a single selection:
| Selection | Odds | Implied probability |
|---|---|---|
| W1 and Total Under 22.5 — Yes | 2.75 | 36.4% |
| W1 and Total On/Over 22.5 — Yes | 2.50 | 40.0% |
| W2 and Total Under 26.5 — Yes | 5.50 | 18.2% |
| W2 and Total Over 26.5 — Yes | 5.50 | 18.2% |
Adding the two “W1 and…” outcomes together: 36.4% + 40.0% = 76.4% — slightly higher than Sonego’s plain match-winner implied probability of 73.8%. That gap (roughly 2.6 percentage points) is the extra margin layered specifically onto the combo market; splitting one outcome into two conditional slices doesn’t just divide the original probability, it adds its own overround on top. Combo markets like this are priced to look attractive individually (each line seems to offer better odds than the plain match-winner bet) while carrying more built-in margin than either of the simpler markets it’s built from.
Doubles Betting
Doubles gets its own market set, generally narrower than singles. The ATP Gstaad doubles pairing Halys/Herbert (1.1, implying 90.9%) against Carou/Cerundolo (6.99, implying 14.3%) shows a heavily lopsided line — margin here (105.2%) sits in the same tight band as singles matches despite the mismatch. Doubles listings typically carry fewer handicap and total variations than singles, since doubles scoring patterns (serve-and-volley points ending faster, less baseline rallying) produce more game-count variance that’s harder to model as precisely.
Extreme Favorites: Qualification and Lower-Tier Rounds
The WTA Iasi qualification match between Elena Pridankina and Georgina Garcia-Perez shows just how lopsided lower-tier lines can get: Pridankina at 1.01 (99.0% implied) against Garcia-Perez at 15.9 (6.3% implied) — a combined 105.3%, essentially the same margin band as an even ATP main-draw match. What differs at this level isn’t the margin, but the underlying uncertainty the number is hiding: qualifying and Challenger-level matches involve far less publicly available statistical history than tour-level matches, so a 99% price here is a stronger statement of market confidence in ranking/form gap than the same number would be in, say, an ATP quarterfinal, simply because there’s more real data behind ATP-level pricing.
ATP at 1xBet
Live Betting: Win Probability, Court Conditions, and What They Actually Tell You
The live match screen shows more than the score — a real-time win-probability bar, current weather, and surface, all displayed above the market list.
Jesper De Jong vs. Vilius Gaubas (Sweden, clay, Round of 32): live probability showed De Jong 66%, Gaubas 34% — notably different from the pre-match-style 1X2 odds (1.44/2.794, implying 69.4%/35.8%), since the live number reflects the match state at that moment (roughly 4 hours 28 minutes before the scheduled time shown on the live countdown, suggesting this was displaying pre-live countdown probability rather than mid-match).
Magda Linette vs. Mai Hontama (Greece, hard court, Round of 32): live probability showed Linette 80%, Hontama 20%, with court conditions displayed at 34°C, wind speed 4.7, and 31% humidity. Heat and humidity are genuinely relevant variables in tennis specifically — high heat makes the ball fly faster and bounce higher, and combined with humidity it affects player stamina over long matches more noticeably than in most other sports. That’s a real, checkable variable, not a decorative widget — worth factoring in before an in-play bet on a match running in extreme heat, particularly on a hard court where ball speed is already higher than on clay.
Wind is the less predictable factor of the two: it disrupts service tosses and can turn a normally reliable server’s hold percentage inconsistent within a single match, which is one reason serve-dependent markets (like a single-set games handicap) can swing more erratically in windy conditions than the overall match-winner line does.
One more detail worth knowing: the “+178”, “+180”, “+176” figures shown at the end of each match row in the compact list correspond to the number of additional markets available on that match’s full page — for example, the detailed De Jong vs. Gaubas match page itself displays “All markets (178),” matching the “+178”-style figure that would appear for it in a compact listing. That number is a genuinely useful signal on its own: matches with a much smaller additional-market count typically have fewer live and derivative markets available at all, which matters if the plan is to bet on something more specific than the plain match winner.
What Actually Moves the Numbers — A Realistic Approach
None of the shortcuts sometimes repeated as “betting strategies” hold up against how these markets are actually priced. A run of long games doesn’t make a short game statistically “due” — each game’s length depends on who’s serving and returning at that specific moment, not some balancing mechanism correcting recent results. Useful analysis instead comes down to checkable factors:
- Surface-specific recent form, not overall ranking — a player’s clay results over the last few months matter more for a clay match than their hard-court ranking, since serve-and-volley-heavy games perform very differently across surfaces
- Head-to-head record on the same surface specifically — a large ranking gap can shrink significantly if the lower-ranked player has a favorable stylistic matchup
- Recent schedule and travel load — a player coming off a long three-setter the day before, or switching climates between tournaments, often shows measurably worse serve and movement numbers in the following match
- Service stats from the last 5-10 matches, not season-long averages — hold percentage and break points saved/converted recently reflect current form better than career numbers
- Where the margin sits on each market type — as shown above, correct score (≈12%) and combo markets carry noticeably more built-in margin than the plain match winner (≈5%) or handicap/totals (≈7-9%), which is worth weighing against how confident the analysis actually is before choosing which market to bet
WTA at 1xBet
Tournament Levels
1xBet lists tennis across every tier of the professional and semi-professional circuit — ATP and WTA (ranked professionals, e.g., ATP Gstaad, ATP Umag, WTA Rome), Challenger and ITF (players outside the top 100), and the UTR Pro Tennis Series (a developmental circuit for younger players building toward the tour). As the qualifying-round example above shows, the built-in margin doesn’t meaningfully change across these tiers — what changes is how much real statistical history backs up the number, which is thinner the further down the tournament ladder a match sits.
Getting Started
Registration takes a few minutes, and once an account is active, live match tracking — including the win-probability bar, weather data, and full market list shown throughout this guide — is available through the Android and iOS apps as well as the desktop site. The same balance covers tennis, every other sport, and casino games without moving funds between sections.
 Aiden Brooks
