Tower is one of the simplest-looking games in any casino lobby and one of the most mathematically transparent — there’s no hidden paytable, no bonus round, no scatter symbols, just a grid, a hidden bomb in every row, and a multiplier that climbs with each safe click. Players browsing the casino games on 1xBet will find it listed as Tower, styled around a neon night-city skyline rather than the generic tower art used in similar games elsewhere, and its entire risk profile is something the player sets before the round even begins. That makes it one of the few casino games where the underlying odds can actually be reverse-engineered from the numbers shown on screen — which is exactly what this review does, level by level, grid by grid.
Registration🎁 Get Bonus 🎁
Tower at a Glance
| Parameter | Value |
| Full title | Crypto Tower |
| RTP | 96.00% |
| House edge | 4.00% |
| Grid options | 2×3, 3×6, 4×9, 5×12, 6×15 |
| Min bet | $0.10 |
| Max bet | $250.00 |
| Max win | $250,000.00 |
| Tile outcomes | Safe tile or bomb tile, one bomb per row |
| Play modes | Manual and Auto |
| Provably fair | Yes, verifiable per round |
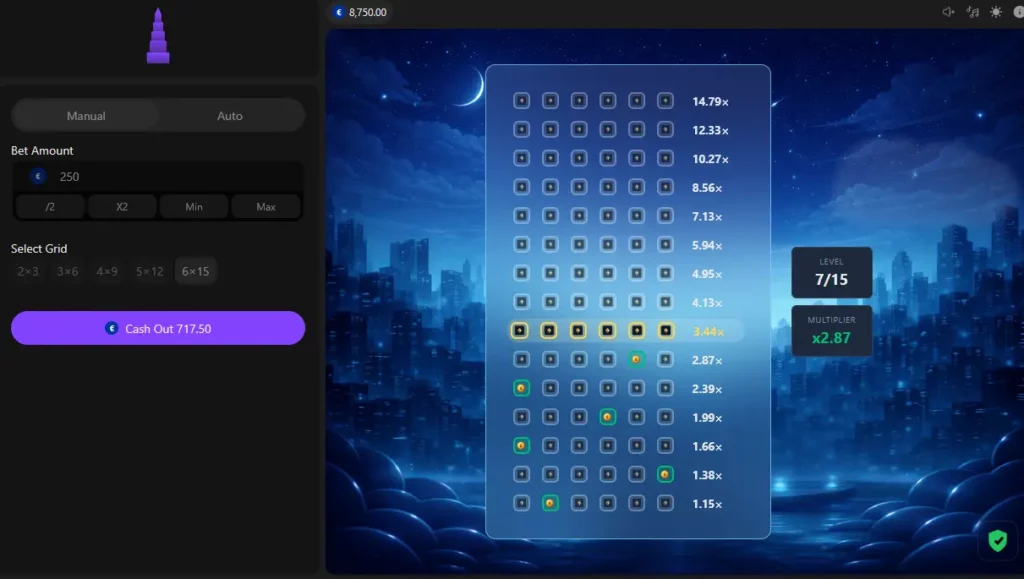
Tower Gameplay at 1xBet
Gameplay Walkthrough: From Bet to Cash-Out
The game screen is split into two halves. On the left is the control panel: a Bet Amount field with quick-adjust buttons (÷2, ×2, Min, Max), and a Select Grid row showing all five available sizes. On the right is the tower itself, rendered against a dark blue skyline with a crescent moon — a LEVEL counter (e.g. “0/9”) and a MULTIPLIER display (starting at “x1.00”) sit beside the grid, and a green shield icon in the corner marks the round as provably fair and verifiable.
A round plays out in a fixed sequence:
- Set the bet amount, from $0.10 up to $250.00, using manual entry or the ÷2/×2/Min/Max shortcuts.
- Choose a grid size — 2×3, 3×6, 4×9, 5×12, or 6×15 — which locks in both the tile count per row and the total number of levels for that round.
- Press Bet to start the climb. The LEVEL counter moves from 0 to 1, and the bottom row of tiles becomes active.
- Pick one tile per row. A safe tile advances the multiplier to the next level’s value and activates the row above; a bomb tile ends the round immediately and the stake is lost.
- Cash out at any point before picking the next tile, locking in whatever multiplier has been reached so far.
- Reach the final level to collect the maximum multiplier for that grid size, which ends the round automatically at the highest available payout.
There is no bonus feature, no wild symbol, and no random trigger anywhere in Tower — every outcome is the direct result of the tile the player selects, which is what makes its odds fully calculable rather than just advertised.
How Grid Size Actually Shapes Risk
The five grid options aren’t just cosmetic — each one changes two things simultaneously: how many tiles sit in every row, and how many rows the tower has in total.
| Grid | Tiles per row | Total levels | Bombs per row |
| 2×3 | 2 | 3 | 1 |
| 3×6 | 3 | 6 | 1 |
| 4×9 | 4 | 9 | 1 |
| 5×12 | 5 | 12 | 1 |
| 6×15 | 6 | 15 | 1 |
Every single row hides exactly one bomb, regardless of grid size — the risk doesn’t come from more bombs, it comes from fewer safe tiles to choose between. On a 2-tile row, the odds of surviving are a straightforward 1-in-2. On a 6-tile row, five of the six tiles are safe, so the odds of surviving any individual level look much better on paper (5-in-6) — but the tower is also five times longer, so that safer-looking single step has to be repeated fifteen times instead of three.
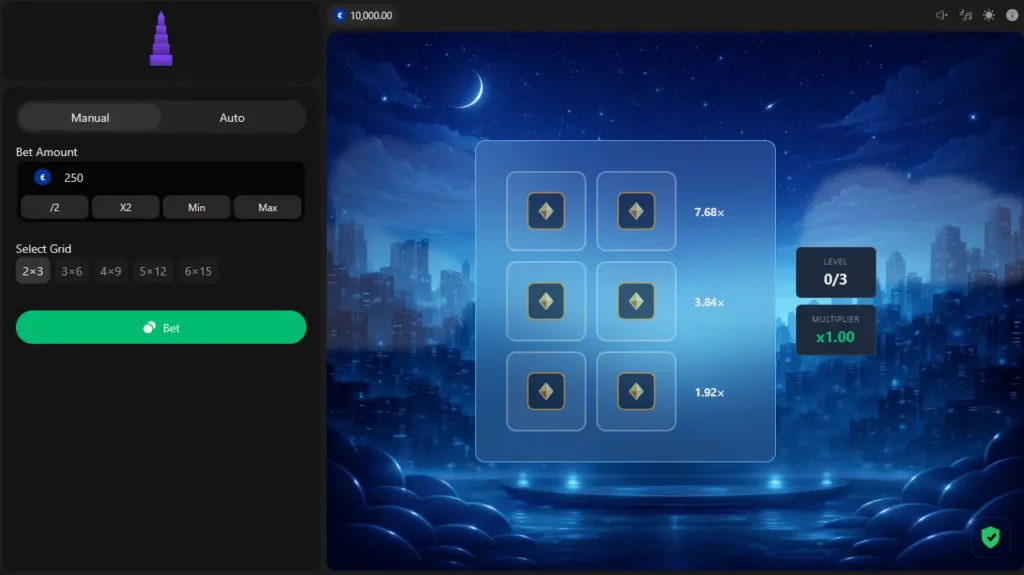
Tower Mini Grid
The Multiplier Formula Behind Every Grid
Tower’s multiplier table isn’t arbitrary — it follows a single formula that holds across every grid size tested:
Multiplier at level n = RTP × (k ÷ (k−1))ⁿ, where k is the number of tiles per row and RTP is 0.96.
The logic behind it is simple: if k−1 out of k tiles are safe, the “fair” payout for surviving one level (with no house edge at all) would be k ÷ (k−1) — a 4-tile row, for instance, has fair odds of 4÷3 ≈ 1.333x per level. Tower then scales every single level’s payout down by the same 0.96 RTP factor, which is why the 4×9 grid’s first level pays 1.28x (1.333 × 0.96) rather than the “fair” 1.333x.
This formula was checked against the in-game multiplier tables for the 2×3, 4×9, and 6×15 grids and matches the displayed values to within normal display rounding at every single level — confirming that the same 96% RTP applies uniformly, not just as an average across the whole game.
Multiplier and Survival-Probability Tables for All Five Grids
Below are the complete level-by-level tables. The 2×3, 4×9, and 6×15 columns are taken directly from the in-game display; the 3×6 and 5×12 columns are calculated using the formula above, since those two grids weren’t captured directly from the interface for this review.
2×3 grid (confirmed in-game):
| Level | Multiplier | Chance of reaching this level |
| 1 | 1.92x | 50.0% |
| 2 | 3.84x | 25.0% |
| 3 | 7.68x | 12.5% |
3×6 grid (calculated):
| Level | Multiplier | Chance of reaching this level |
| 1 | 1.44x | 66.7% |
| 2 | 2.16x | 44.4% |
| 3 | 3.24x | 29.6% |
| 4 | 4.86x | 19.8% |
| 5 | 7.29x | 13.2% |
| 6 | 10.94x | 8.8% |
4×9 grid (confirmed in-game):
| Level | Multiplier | Chance of reaching this level |
| 1 | 1.28x | 75.0% |
| 2 | 1.71x | 56.3% |
| 3 | 2.28x | 42.2% |
| 4 | 3.03x | 31.6% |
| 5 | 4.05x | 23.7% |
| 6 | 5.39x | 17.8% |
| 7 | 7.19x | 13.3% |
| 8 | 9.59x | 10.0% |
| 9 | 12.79x | 7.5% |
5×12 grid (calculated):
| Level | Multiplier | Chance of reaching this level |
| 1 | 1.20x | 80.0% |
| 2 | 1.50x | 64.0% |
| 3 | 1.88x | 51.2% |
| 4 | 2.34x | 41.0% |
| 5 | 2.93x | 32.8% |
| 6 | 3.66x | 26.2% |
| 7 | 4.58x | 21.0% |
| 8 | 5.72x | 16.8% |
| 9 | 7.15x | 13.4% |
| 10 | 8.94x | 10.7% |
| 11 | 11.18x | 8.6% |
| 12 | 13.97x | 6.9% |
6×15 grid (confirmed in-game):
| Level | Multiplier | Chance of reaching this level |
| 1 | 1.15x | 83.3% |
| 2 | 1.38x | 69.4% |
| 3 | 1.66x | 57.9% |
| 4 | 1.99x | 48.2% |
| 5 | 2.39x | 40.2% |
| 6 | 2.87x | 33.5% |
| 7 | 3.44x | 27.9% |
| 8 | 4.13x | 23.3% |
| 9 | 4.95x | 19.4% |
| 10 | 5.94x | 16.2% |
| 11 | 7.13x | 13.5% |
| 12 | 8.56x | 11.2% |
| 13 | 10.27x | 9.4% |
| 14 | 12.33x | 7.8% |
| 15 | 14.79x | 6.5% |
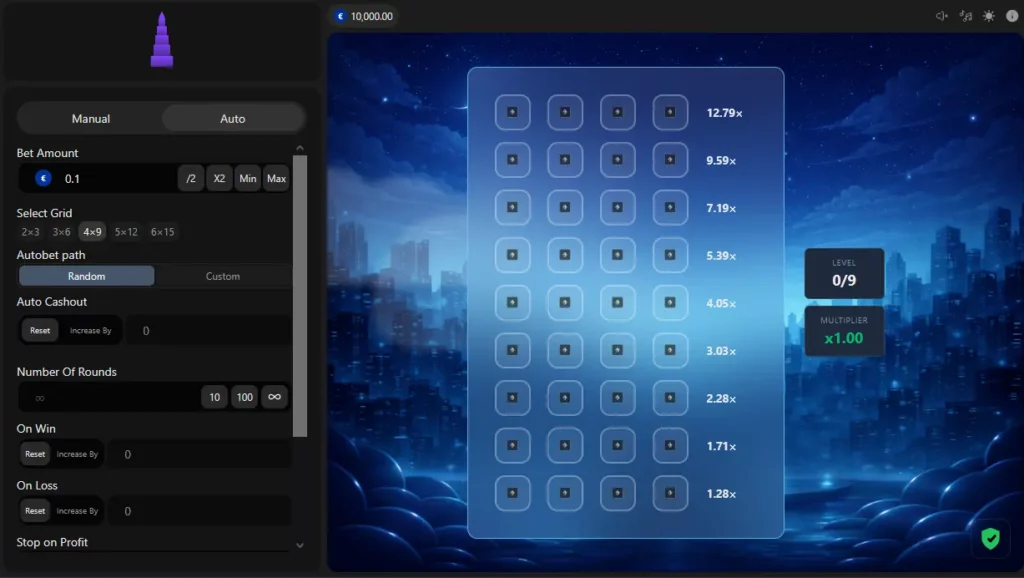
Tower Auto Settings
Proving the RTP: Expected Value at Every Level
The genuinely useful thing this data allows is checking whether cashing out early or pushing for the top actually changes the game’s return — and the answer is no. Expected value (multiplier × probability of reaching that level) comes out to essentially the same number, roughly 0.96, at every level on every grid:
| Grid | Level | Multiplier | Survival probability | Expected value |
| 2×3 | 1 | 1.92x | 50.0% | 0.960 |
| 2×3 | 3 | 7.68x | 12.5% | 0.960 |
| 4×9 | 1 | 1.28x | 75.0% | 0.960 |
| 4×9 | 5 | 4.05x | 23.7% | 0.961 |
| 4×9 | 9 | 12.79x | 7.5% | 0.960 |
| 6×15 | 1 | 1.15x | 83.3% | 0.958 |
| 6×15 | 10 | 5.94x | 16.2% | 0.959 |
| 6×15 | 15 | 14.79x | 6.5% | 0.960 |
Bold takeaway: there’s no “smarter” level to target purely on expected value — cashing out at level 1 and pushing to the final level both return the same ~96 cents per dollar wagered on average. What actually changes between an early cash-out and a full climb is variance, not expected return: cashing out early means smaller, more frequent wins, while pushing to the top means rare, large payouts and far more total losses along the way.
Worked Examples: What Different Bets Actually Pay
A few concrete scenarios based on the tables above:
- A $20 bet on the 2×3 grid, cashing out at level 2 (3.84x): payout is $76.80, reached with a 25% chance of getting that far.
- A $50 bet on the 4×9 grid, cashing out at level 6 (5.39x): payout is $269.50, reached with a 17.8% chance.
- A $100 bet on the 6×15 grid, pushing to level 12 (8.56x): payout is $856.00, reached with an 11.2% chance.
- A $250 max bet on the 6×15 grid, reaching the final level 15 (14.79x): payout is $3,697.50 — well short of the $250,000 theoretical max win, which would require the 6×15 grid’s top multiplier applied to something closer to a higher stake than the platform’s current $250 cap allows in a single round, meaning the advertised max win reflects a ceiling figure rather than something reachable on every bet size.
Manual Play vs. Auto Mode
Tower offers two distinct ways to play:
- Manual mode requires clicking through the grid tile by tile, deciding after every safe reveal whether to continue or cash out — full control, one decision at a time.
- Auto mode runs a pre-configured session without manual confirmation at each step, using the following settings:
- Autobet path — Random (tiles picked automatically at random each round) or Custom (a fixed tile pattern set by the player in advance)
- Auto Cashout — a target level at which winnings are automatically collected every round, adjustable between rounds via Reset or Increase By
- Number of Rounds — 10, 100, or unlimited (∞)
- On Win / On Loss — automatic bet-size adjustments after a winning or losing round, again via Reset or Increase By
- Stop on Profit — an optional session-ending threshold once a target profit is hit
Example Auto configuration: a $0.10 base bet, Auto Cashout set to level 4 on the 4×9 grid (3.03x), Number of Rounds set to 100, and Stop on Profit set to $20 — this would run up to 100 automated rounds, collecting 3.03x on any round that reaches level 4, and halt early if cumulative profit hits $20. Since the underlying RTP doesn’t change in Auto mode, this kind of setup manages session pacing and discipline, not the actual odds.
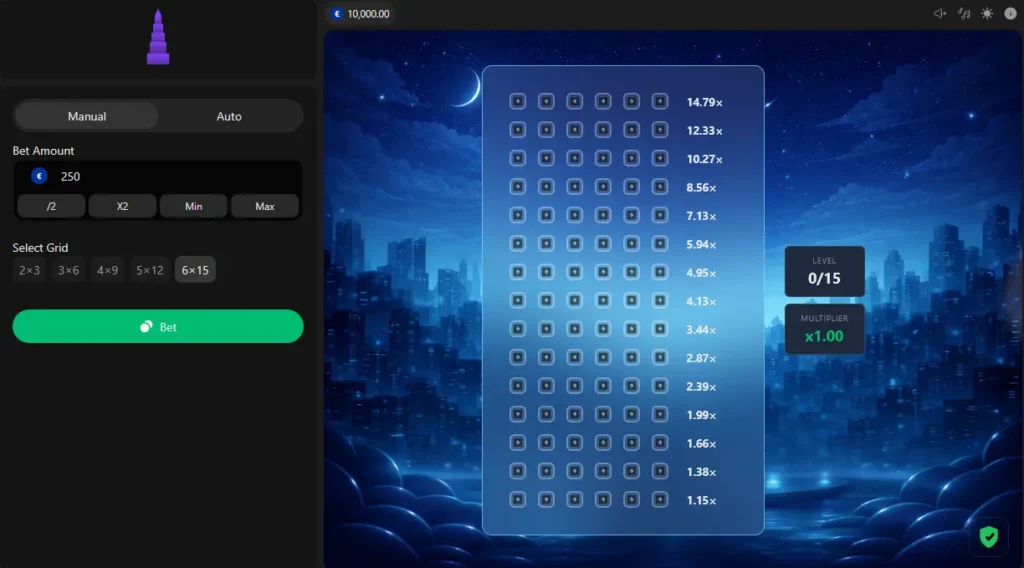
Tower 6×15 Grid
Choosing a Grid Size for Your Playing Style
- 2×3 or 3×6 suit players who want frequent, smaller wins and a short commitment per round — survival odds per level are the best of the five options, at the cost of a lower ceiling.
- 4×9 sits in the middle: a 75% survival chance on the first level, a full nine-level climb, and a top multiplier just under 13x.
- 5×12 and 6×15 suit players deliberately choosing higher variance — survival odds per level drop as low as 83.3%, but stack across far more levels, and the payoff for reaching the final rows is substantially larger.
Bankroll Approach for a Fixed-Odds Climbing Game
Because every level in Tower is an independent bet against a fixed, known probability, a session plan built around bet sizing and a pre-set cash-out target works better than deciding level-by-level in the moment:
- Expect to lose 4% of total wagered on average over many rounds, regardless of grid size or cash-out point — that’s the fixed house edge, and no combination of grid choice or cash-out timing changes it.
- Size bets so that a single bust doesn’t meaningfully affect the session bankroll, since even the safest grid (2×3) still carries a 50% chance of losing the entire stake on the very first tile.
- Pick a target level before the round starts, especially on 5×12 or 6×15, where the temptation to push past a strong multiplier grows with every safe click while the underlying survival odds keep shrinking.
- Use Auto mode’s Number of Rounds and Stop on Profit settings to cap session length mechanically, rather than relying on in-the-moment discipline during a hot streak.
Getting started only takes a standard registration, after which Tower is available directly from the casino section by searching the game name. It’s also fully playable through the Android app or the iOS app, with the same grid options, multiplier tables, and Auto mode settings as the desktop version.
🎁 Get Bonus 🎁
LoginRegistration
Other slots at 1xBet